
Price-Led Growth Gives Way to Early Volume Recovery
MSC Industrial reported third quarter results on July 1, 2026. Net sales increased 7.8% to $1.047 billion, driven mainly by price with a little volume. Price contributed about 720 bps to growth; volume contributed roughly 50 bps, indicating an inflection back to positive volume after Q2 weakness. Gross margin was 41.1%, slightly above expectations, driven by benefits from price/cost and customer mix.
Execution by Segment & Sales Channel
- By Sales Channel
- Core Customer Growth (core customers are mid-market manufacturers) increased 8%, again outperforming company-wide sales for the fourth consecutive quarter.
- National Accounts Sales – were up 7%, a strong improvement from the previous flat results, as relationship/coverage work stabilizes and returns to growth and the consolidation of MSC rep org starts to bear fruit.
- Public Sector Sales — daily sales increased 8%, driven by higher defense activity and an easier prior-year comparison. This was an improvement from last quarter’s 1% decline.
- By Customer:
- Manufacturing end markets – grew 6.8% with pricing in metalworking/cutting tools elevated due to commodity inflation.
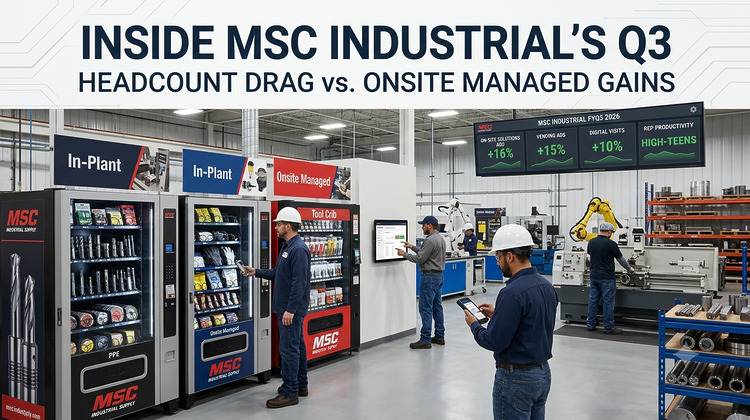
- Vending Solutions (Vending and In-Plant) – Vending increased 15%, now representing 20% of sales. Installed base up 7% YoY to ~30,800 machines. In-Plant programs sales increased 16%, now representing 21% of net sales. Customer count is up 7% YoY to 426 programs. Vending solutions growth was driven by a combination of installed‑base expansion, deeper usage at existing sites, and the structural shift toward managed, on‑site MRO programs. Once installed, vending usage tends to deepen over time as customers add more SKUs and categories (e.g., safety, PPE, abrasives, tools), standardize more spend onto the vending platform and expand from pilot areas to plant‑wide deployments.
- Web Channel (mscdirect.com) – Web channel grew in the double‑digit range, underscoring strength in uncovered small/core accounts. MSC reported double‑digit increases in site visits and better conversion rates versus the prior year, driven by improved site experience and search/navigation for core MRO and metalworking buyers and more effective digital merchandising and content around high‑velocity SKUs and applications. Digital has become MSC’s primary channel for acquiring new small and core customers who prefer self‑service and don’t warrant a full field sales call and for serving “uncovered” accounts that previously bought sporadically or from competitors, now converted via targeted online campaigns and SEO/SEM.
MSC Key Management Insights
- CEO Martina McIsaac said the recovery is in the “third inning,” citing changing summer shutdown patterns (especially in automotive) and improving IP/MBI readings as early signs of restocking and added shifts.
- After flat/negative volume in Q1–Q2, volumes turned positive in April and stayed positive through June across all customer types; management expects this to continue
- Management emphasized sales per rep per day up high‑teens % YoY. This was attributed to fewer field reps (‑225) and total headcount (‑360 YoY), and a new variable comp plan that makes SG&A more responsive to sales.
- Price contributed ~7.2% YoY in FYQ3; management expects 6.5–7% price in YQ4 as it begins to lap prior‑year tariff/price actions. Tungsten remains the largest inflation driver, up >500% YoY, with more supplier price hikes expected.
- Management highlighted a $500M opportunity pipeline in growth forums, with about 10% converted on an annualized basis so far, as a lever for future volume growth.
- Capital allocation priorities CAPEX investments to strengthen operations, digital capabilities and service offerings, and M&A focused on bolt-on acquisitions in underserved regions, adjacent product categories, technologies, and high-growth end markets.
The Industrial Distribution Channel is Up for Sale
- Let’s explore recent industrial distribution M&A activity…. recent M&A activity has been active and scale‑focused, with 2026 so far showing a rebound in deal volume and value versus late‑2025, particularly in building products, electrical, janitorial‑sanitation, specialty industrial, and landscape supply. (See Distribution Deal Boom Tops $19 Billion as Buyers Race for Scale – Distribution Strategy Group, June 2026.)
- In the first five months of 2026, more than $19 billion has been committed to wholesale distribution acquisitions, led by very large building‑products deals but with a steady stream of transactions across industrial subsectors.
- Deal volume has been resilient with 78 announced U.S. distribution transactions in Q1, roughly in line with the prior year.
- Strategic buyers (corporates, large distributors) dominate activity, accounting for the majority of deals (often 85–90%+), while private equity is increasingly active again as interest rates stabilize and tariff clarity improves.
- Ongoing bolt‑on M&A by regional and national MRO distributors continues (e.g., Turner Supply, Winsupply, GME Supply, etc.), often targeting local MRO and workwear/PPE suppliers, niche fluid power, pump, and automation specialists and safety and utility/oil‑&‑gas focused distributors.
What Analysts Asked MSC About Operating Leverage, Price and Demand
- Analyst questions centered the FYQ4 operating leverage step‑down guidance as analysts questioned why incremental margins are expected to fall from low‑30s in FYQ3 to mid‑20s in Q4 despite continued sales growth. Management attributed this to timing of prior‑year actions, freight headwinds (lapping network optimization savings) and higher D&A. Several asked how much of the FYQ4 guidance is real volume vs. price driven tougher comps. Management said price will moderate to 6.5–7% and volume should still improve at the midpoint, albeit against a ~300 bps tougher volume comp.
- Management says the company is about “1,000 heads heavy” in headcount compared to peers framing it as a multi‑year productivity program focused on automation/AI, process redesign, and growing without adding heads rather than a single large layoff event.. Finally, there were questions on whether cutting tool demand might weaken under sustained tungsten price increases. Management said volumes are still growing and it does not yet see demand destruction but expects continued supplier price hikes.
MSC’s FYQ4 Guidance (CYQ3)
- MSC Industrial guided fiscal Q4 2026 average daily sales growth at +6.5% to +8.5% YoY, and gross margin having a sequential decline of 40–50 bps, which they emphasized is a typical Q3 to Q4 pattern.
- Implicitly, management is signaling continued price‑led growth with expanding volume, but a modest near‑term step‑down in operating leverage as freight and comp dynamics shift.
Industrial Supply Trends’ Observations
- As one of the first industrial companies reporting earnings during the quarter, MSC is a leading indicator for broadline MRO distributors. The “third inning” recovery description, positive manufacturing IP/MBI readings, and customers canceling or delaying planned shutdowns suggest the MRO demand cycle is turning up, albeit unevenly by end market.
- Like many distributors, MSC rode a long price/inflation wave; now, price contribution is peaking and volume is re‑emerging. For the sector, this implies that top‑line growth becomes more volume‑driven and less dependent on passing through commodity inflation.
- Winners will be those who grow without proportionally growing SG&A, leveraging AI. Expect more peers to talk about salesforce optimization, variable comp redesign, and digital leverage.
- Double‑digit growth in vending and in‑plant ADS and their outsized share of sales, around 40% combined, MSC reinforced that onsite, managed solutions are critical for share gains and stickiness in MRO. Distributors with strong vending/in‑plant platforms should see better volume elasticity as capex and utilization improve.
- Persistent tungsten/carbide inflation shows that input cost volatility remains a margin and pricing complexity for metalworking‑heavy distributors. Companies that can manage price professionally without destroying demand will outperform.
- Overall, MSC’s FYQ3 suggests the MRO/industrial distribution sector is moving from a price‑led, margin‑recovery phase into an early volume‑recovery phase, where operational excellence, digital/channel mix, and solutions depth will increasingly separate leaders from laggards.
- Manufacturing output trends are one of the primary drivers of MRO distribution demand because they determine how intensively plants run their equipment, how much they invest in keeping assets reliable, and how much they defer or accelerate maintenance and upgrades.
- Recent data show U.S. manufacturing activity in a modest but sustained expansion, with new orders and production indices above 50 for several months but cooling slightly from spring peaks, while industrial production (IP) has been choppy but trending modestly higher year over year.


Leave a Reply