This is the inaugural article for a series in ISA focusing on the top industries and products for industrial supply distributors from Kevin Coleman our collegue at Channel Marketing Group. Kevin has 30 years experience leading Market Intelligence teams for leading manufacturers such as Avaya, Philips Lighting, and Signify.
Kevin will each quarter, profile a different industry or product category, providing basic facts, trends and drivers and what it means for industrial distribution channel opportunities for Industrial Supply Trends.
Why is this important? The health of the durable goods market is often viewed as an indicator of the overall health of the economy. For consumers, these products tend to be high-dollar items, and consumers may postpone buying them depending upon price and other factors. When consumers delay purchasing new vehicles or refrigerators, it indicates more people are feeling insecure about their income or savings.
Another category of durable goods is for business – generally called capital expenditures or CAPEX. This is company spending used to acquire, upgrade, and maintain physical assets such as property, plants, buildings, technology, and equipment. This is an important indicator of business investment and confidence.
There are two major subcategories of manufactured goods – durable and nondurable. Nonurable goods are manufactured goods that are consumed over a short period of time – food, fuel, office products. Durable goods are products that yield utility over a long period of time, typically 3 years or more – automobiles, appliances, machinery.
Why does this matter? In particular, CAPEX is an important gauge of business spending. Industrial manufacturers will need to maintain and service machinery and structures, so these represent the end-customers.
Industrial Supply Baseline Facts
Manufacturing represents the largest opportunity for industrial suppliers. This is a critical industry for the US economy – the US is the world’s second largest manufacturer, behind China. This sector employes 12.8 million people, showing recent stabilization after decades of decline, and generated $2.6 trillion in value-added dollars, contributing nearly 11% of total GDP in 2022.
Manufacturing covers a vast range of products, which is categorized and defined by the North American Industry Classification System (NAICS) as codes 31-33. This includes establishments involved in transforming materials, substances, or components into new products using power-driven machines and material handling equipment.
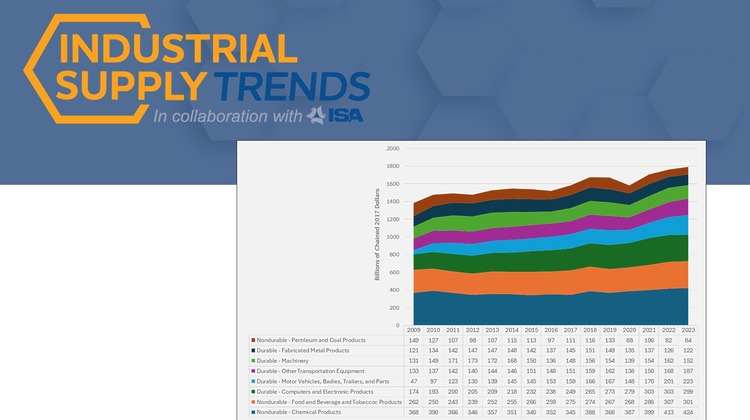
Details over time can be seen in the following chart showing the value add contribution by manufacturing for the top durable and nondurable goods segments. Using data from the BEA shows that manufacturing increased by 0.6 % between 2022 and 2023. Computer and electronic products along with motor vehicles, bodies and trailers, and parts grew 42.8 % and 61.0 %, respectively from 2013 and 2023.
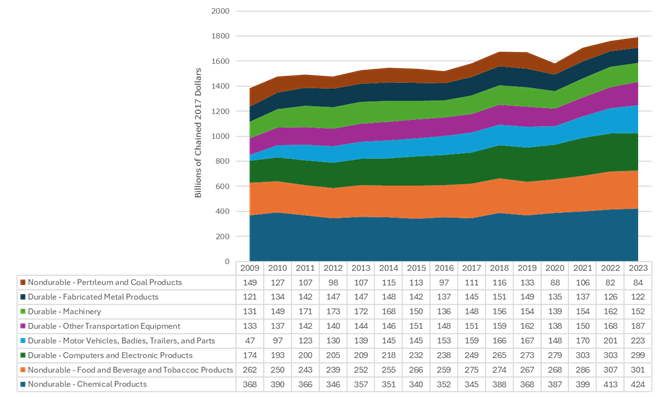
Value Added for Top Durable/Nondurable by Segment (billions of chained dollars), 2009-2023
Another useful perspective to look at the customer base for industrial suppliers is through the lenses of the stock of equipment and structures. The US Bureau of Economic Analysis publishes data on fixed assets. This represents the assets that must be regularly cleaned and maintained and serviced by industrial suppliers. The following table (appended with Bureau of Labor Statistics data for number of establishments and number of employees):
| # Firms | # Employees | Net Stock Value – Private Equip $b | Net Stock Value – Private Structures $b | |
| Manufacturing | 403,116 | 12,761,000 | 1,796 | 1,938 |
| Food and Beverage | 59,606 | 2,022,212 | 243 | 257 |
| Petro & Coal | 2,603 | 109,300 | 143 | 139 |
| Chemicals | 25,684 | 902.300 | 258 | 309 |
| Computer & Electronics | 26,483 | 1,010,300 | 148 | 245 |
| Transportation Equip | 19,018 | 1,734,900 | 218 | 222 |
| Machinery | 34,852 | 1,113,200 | 127 | 124 |
| Fabricated Metal | 61,655 | 1,437,000 | 150 | 106 |
An important resource for tracking manufacturing is the Institute for Supply Management’s (ISM) US Manufacturing Purchasing Manager’s Index (PMI). The PMI is an index based on month over month comparisons (50=no change), comprised of an equal-weighted average of 5 subindexes – new orders, production, employment, inventories, and supplier deliveries.
In January and February 2025 ISM PMI reported that US manufacturing expanded for the first time in 26 months, registering 50.9 and 50.3 percent. Of the six largest manufacturing industries, four showed growth in January – Petroleum and Coal Products, Chemical Products, Machinery and Transportation Equipment.
Recent Trends in Manufacturing
The manufacturing sector has been a central focus of government initiatives and investments for some time, going back to the Buy American Act dating to 1933 requiring the government to give preference to US made products in its purchases. Recent decades have seen initiatives ranging from support for the defense and aerospace industries, energy, robotics, pharmaceutical and genome, to electronics. In addition, policies like Made in America, and Buy America Build America (BABA) have been developed recently, partially in response to the pandemic and to increase the resilience of domestic supply chains.
Returning manufacturing jobs to the US is a cornerstone of the Trump administration, and some of the more prominent announced investments include:
- Japan pledged to boost US investment by roughly $1T
- Saudi Arabia pledged to invest $600b over 4 years
- Stargate Project AI venture – $500b
- Apple pledged to invest $500b over 4 years
- SoftBank Group investing $50b
- Eli Lilly investing $50b
- The UAE announced plans to invest $20b in the US data center industry
- Many companies are actively considering shifting manufacturing to the US to avoid tariffs (e.g., Honda)
The headline topic for manufacturers has been tariffs and the news flow risks whiplash. Suppliers should focus on the underlying incentives for particular nations and the evolution of the administration’s priorities, and not get caught up in the hectic daily reporting. Industrial suppliers can follow the advice of John Gunderson and David Gordon, outlined in the article Industrial Tariff talk that can be found on the Industrial Supply Trends website. John and David developed a contingency planning checklist. Regardless of the outcome, and there will be many twists and turns over the next months, you must act quickly, develop contingency plans and think hard about supplier relationships. Be prepared, as margin pressures will increase.
When it comes to Canada and Mexico, there are strong incentives all around to avoid tariffs. Both countries are highly dependent on US demand. Further, tariffs would be disruptive to US manufacturing and cumbersome to implement, since there is a high degree of integration in manufacturing in North America (co-production, especially in autos), with some intermediate goods crossing borders more than ten times. With the United States-Mexico-Canada Agreement USMCA due for review in 2026, and news reports suggesting President Trump’s intentions to do it sooner, tariffs against Canada and Mexico are aimed at increasing the US’s leverage in these negotiations.
By contrast, tariffs on China must be viewed through the broader lens of geopolitics. Since US-China tensions are likely here to stay, most of the tariffs will likely remain.
There is also a strong geopolitical element to a potential moderate European tariffs – there are three primary reasons for European tariffs: 1) the US trade deficit of nearly $240bn; incentivize European auto companies to make more cars in the US, and iii) European countries to bear more of the burden of NATO by increasing their defense spending.
Other trends impacting manufacturing in 2025:
- The need to invest in resilient supply chains – manufacturers continue to adapt to labor shortages, geopolitical tensions, inflation, and tariffs by automation, digitization and reshoring operations
- Nearly 60% of manufacturers in the National Association of Manufacturers survey for 3Q24 cited inability to attract and retain employees as their top challenge
- Accelerating digitization – investing in digital transformation to lower costs; innovate, develop and deliver products faster; help with skill shortages and supply chain challenges
- Hand-in-hand with digitization is cybersecurity
- Harnessing AI to transform manufacturing – one of the key digitization investments is the shift to enterprise-wide AI strategies to improve operational efficiencies to maintain competitiveness
- Sustainability – customers are demanding greener solutions, requiring investments
- Stubborn inflation remains a challenge – the Producer Price Index (PPI) for material inputs and components, while stabilizing, remains elevated
- Additive manufacturing – facilitate rapid prototyping, weight/material savings, and lower cost production for small batches/customized products
- Increased M&A activity as companies pursue acquisitions to improve supply chains, inshore, adapt advanced technologies and scale
These trends show that there is great dynamism in the manufacturing segment as it continues to evolve and is entering an exciting and renewed era of expansion. This will open up more opportunities for industrial suppliers to meet the changing and growing demands of manufacturers.
As always, if you have comments or questions, please reach out to Kevin Coleman ktcoleman5fam@gmail.com or connect with him at (5) Kevin Coleman | LinkedIn
Leave a Reply